简介
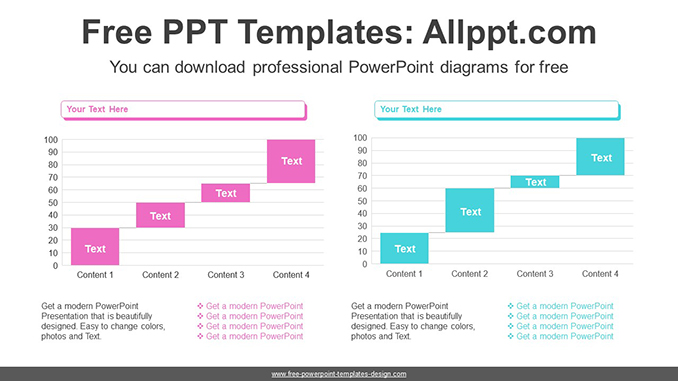
这是通过放置两个瀑布图进行比较的图表。这是一个简洁的图表,填充了空间,因此可以轻松解释数据。瀑布图允许您通过输入公式轻松调整数值。
搜索关键词: PowerPoint, 图表, 模板, 演示, 图形, 图形, 图标, 信息图表, 信息, 想法, 布局, 数据, 设计, 过程, 进展, 形状, 步骤, 符号, 概念, 连接, 创意, 可编辑, 分析, 分析, 审计, 商业, 图表, 元素, 管理, 部分, 报告, 研究, 结果, 统计, 统计, 会计, 酒吧, 改进, 增加, 规划, 积极, 项目, 报告, 规模, 分数, 统计, 瀑布
比较瀑布图幻灯片图
This PowerPoint diagram template has theme color applied. So when you do simple copying and pasting, the color will be applied automatically. In addition, shapes and text are 100% editable
This âComparative Waterfall Chart PowerPoint Diagramâ Preview:

This template can be used for school classes, business purposes, and commercial purposes. However, this template cannot be distributed absolutely.
文章评论