简介
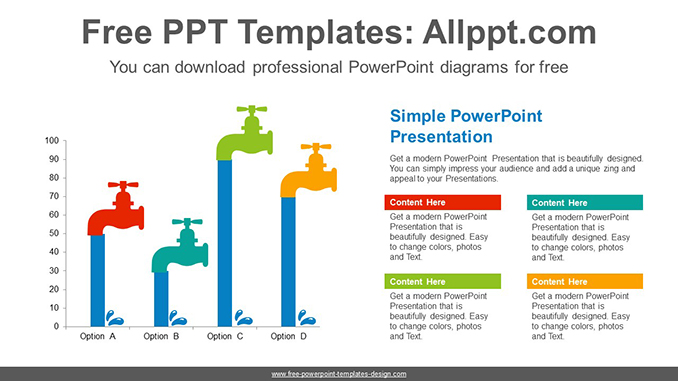
这个直径是从水龙头流出的水的条形图。此条形图可帮助您可视化变化、比较、增长率等。您还可以使用简单的公式输入来修改数据。
搜索关键词: PowerPoint, 图, 模板, 演示, 图形, 图形, 图标, 信息图表, 信息, 想法, 布局, 数据, 设计, 过程, 进展, 形状, 步骤, 符号, 概念, 连接, 创意, 可编辑, 分析, 分析, 审计, 商业, 图表, 元素, 管理, 部分, 报告, 研究, 结果, 统计, 水龙头, 水, 流动, 酒吧
水龙头 条形图 幻灯片图
This PowerPoint diagram template has theme color applied. So when you do simple copying and pasting, the color will be applied automatically. In addition, shapes and text are 100% editable
This ‘Faucet Bar chart PowerPoint Diagram’ Preview:

This template can be used for school classes, business purposes, and commercial purposes. However, this template cannot be distributed absolutely.
文章评论